FemtoScan Wiki
[[en:processing:сечения]]
Trace: • 3D image preferences window • Открыть файл • Build Sections
Login
You are currently not logged in! Enter your authentication credentials below to log in. You need to have cookies enabled to log in.
Build Sections
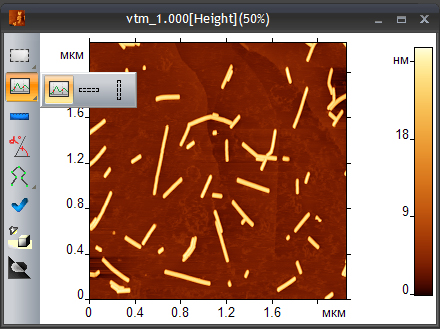
There are three different instruments for sections in the program: Build row cross-section, Column cross-section and arbitrary cross-section. They are grouped into the dropdown panel in the image toolbar:
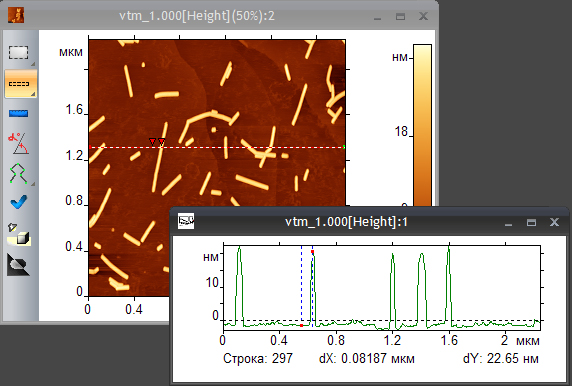
In order to build row or column cross-section select the point through wich you wish to plot the cross-section. A new window with a line profile will appear and the current position of the line will be shown on the original image. The color and thickness of the line marking the position of the cross section on the original image can be ajusted in the Image options.
You can measure the distances and angles between different points of the cross-section using marks. To do this select the mode Vertical Lines in the Section preferences, place the marks to the right places and find the measured values in the text line in the bottom of the window: dX - the horizontal distance between marks, dY - the vertical distance between them. If you select the value Angle for the parameter Marks → Y Value in the Section preferences, then an angle dY/dX will be shown instead of dY in the text line.
If you want to copy the measured data to the clipboard, use special commands Copy text and Add text from the Edit menu.
With the arrow keys you can move the cross-section row or column up and down the image. To do this the Section window should be active. You can delete the selected row or column from the image by the operation from the menu Line Remove. There are also commands Replace to Upper, Replace to Lower and Smooth using which the selected row (or column) will be replaced by the values from the line, located above selected (or located to the left from the selected column), lower (right), the average values between them.
The important parameter in the Section preferences dialog box is Section width. The value of this parameter is set to 1 by default, in this case the profile corresponds to the selected row Z(X). But if you set a larger value of this parameter (only odd values are valid), then instead of the current value Z an average value between the neighboring rows will be displayed in the profile.
To build an arbitrary cross-section, select the tool  specify the start point with the left mouse click and release the button at the place where the cross-section should be ended. Moving with arrow keys and removing of arbitrary sections from the images is prohibited, otherwise work with arbitrary cross-sections is similar.

