Determination of the height of objects based on the interference pattern
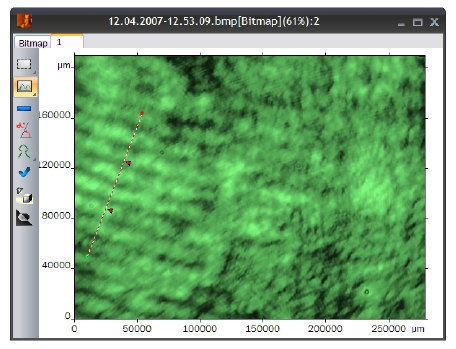
This feature is designed for measuring the slope of the growth hillock on the surface of the crystal based on the interference pattern recorded with an optical microscope. Select one or more segments, the slope of which you want to measure. To do this, you can use tools Section или Linear.
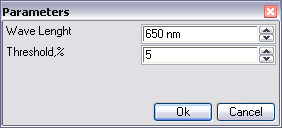
Then call up function Height from interference figure. A menu will appear with the parameters shown in the figure below, where the wavelength of incident light and the threshold determining the minimum value of the amplitude taken into account when determining the period. The threshold value is specified as a percentage of the maximum amplitude on the image.
When you launch this function, all the calculations will be made automatically using parameters set by default. If they do not fit your case, they should be reset. The calculation results are displayed in a tabular form and include the following information:
- Drop – the value of height decrease on the selected segment,
- Distance – the distance between the ends of the selected segment,
- Angle – the slope angle of the crystal in the selected area (calculated if the current measurement units on the image allow that).
To ensure that the optical image in a graphics format is correctly calibrated axially, use dimensional segments on the image and Resolution function.


