Roughness analisys
Function Roughness analysis in menu Mathematics calculates a set of parameters characterizing the surface roughness in the selected area, or the whole image.
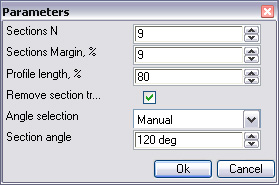
If you call up this function, a dialog box, in which several options for further analysis can be configured, will appear.
In the simplest case, roughness (i.e., R_a, the average roughness) is the arithmetical mean deviation of the profile from an inclined straight line. A few cross-sections are built in order to determine the average surface roughness. Dialog box Parameters allows you to select the number of such cross-sections, the distance between adjacent cross-sections, the length of the cross-sections and their horizontal slope angle.
The slope angle can be set manually. If the surface has a layered structure, it is best to determine the angle automatically. In this case, cross-sections will be drawn in a direction perpendicular to the direction with the lowest roughness. In addition, a window with a histogram, based on which this direction was determined, will be displayed. It will show how the average number of intersections of the cross-section depends on its mean line from the angle. The minimum dependency corresponds to the direction of the steps. Parameter Accuracy is a step along the angle used in the construction of the diagram.
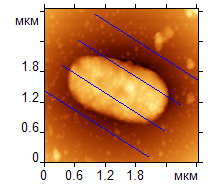
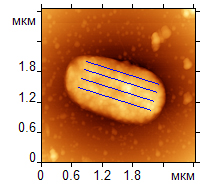
It is important to draw cross-sections along the area of interest on the image. If you want to determine, for example, the roughness of the bacteria, the cross-sections should fall only on the horizontal part of the bacteria, where the roughness, and not the general surface pattern of the cells contributes to the height (on the left you can see incorrect drawing of cross-sections, on the right - the correct drawing). In addition, you can always cut a part of the image that interests you using function Crop and work with the created image.


