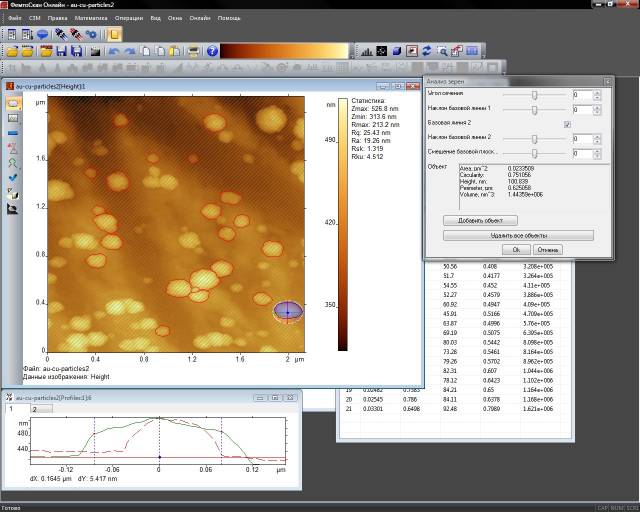
Object Analysis
The object analysis function allows you to highlight objects, calculate their spatial characteristics, and analyze them with the help of a histogram.
The function is called up using menu command Mathematics/Object Analysis or using the button on the Tool Bar::
The sequence of work with objects is performed in several steps:
- Selecting the area where the object lies
- Adjustment of the object’s highlighting parameters:
- Rotation angle of the reference lines
- Slope angles of the reference lines
- Offset of the reference plane
- Addition of the object to the list of objects
After adding the object the operation is repeated until all the objects are highlighted.
The algorithm of object highlighting is as follows:
Firstly, the maximum, which becomes the object’s center, should be found in the selected area where the object lies. A straight line is drawn from the object’s center to every point of the selection perimeter. Then a cross-section profile is formed along this direction. The point located the furthest from the straight line is considered the object’s border. After making similar plots to every point of the highlighting perimeter, we obtain the object’s border. Selection area can be either simple rectangular and more complicated, i.e. elliptic, or can have a complex shape obtained as a result of addition or subtraction of the areas.
After the object is highlighted, its reference plane, which will be used in the calculation of the object’s parameters, is formed. To form a reference plane, one or two reference lines crossing in a projection in the object’s center are drawn. Rotation angles of the reference lines in plane X-Y and about axis Z are defined by respective parameters. The zero offset of the vertical crossing point of the reference lines, also known as the offset of the reference plane, is chosen equal to the average height of the object’s perimeter points. The maximum value of the offset (modulo) is limited by the object’s height. Both when mapping the surface and making a sectional drawing, the first reference line is drawn in green color, while the second one is drawn in red. The sectional drawing displays surface profiles along the reference lines.
In the object analysis dialog you can see a number of parameters:
- Profile angle – the rotation angle of reference line 1 in plane X-Y; reference line 2 is drawn perpendicularly to line 1.
- Baseline 1 Angle – horizontal offset of reference line 1.
- Baseline 2 is used to draw or not to draw reference line 2. If the reference line 2 is not drawn, it is automatically considered to be perpendicular to reference line 1 and lying in plane X-Y (i.e. the slope angle is 0).
- Baseline 2 Angle – horizontal offset of reference line 2.
- Base Plane Offset – offset of the crossing point of the reference lines from the average perimeter height, positive value – up.
- Values – calculated values of the object’s geometrical parameters are displayed in this field.
- Add Object button is used to add an object to the histogram and the table of objects, and to highlight its contours in the initial image.
- Delete Object button is used to remove the currently selected object. The object is identified based on its center, i.e. there cannot be two objects with the same center and if you try to add an object with the same center, the previous object will be removed.
- Delete all objects button is used to delete the list of objects: the histogram, the table and the object’s contours in the drawing.
The selected objects are inserted into the table, and the distribution histogram is formed based on the table. The column based on which the histogram is formed is selected by clicking the column heading. Simultaneously, data sorting is performed in the table based on this parameter.
The object analysis dialog closes upon clicking OK but the selected objects are saved in the computer memory and will be restored during the next function launch. To empty the list of objects use the Delete All Objects button.
To cancel the highlighting of the current object before closing the dialog click anywhere in the picture – this will cancel the current highlighting and if there are any highlighted objects in the list, only their contours will be shown.

